Choosing a Kubernetes dashboard for your team
Every Kubernetes team eventually asks the same question: do we need a dashboard? The answer is almost always yes, even if you resist it. kubectl is powerful, but sometimes you want to see what’s running without typing commands. Sometimes a new developer needs to understand the cluster without learning the CLI first. Sometimes you just want a quick visual overview during an incident.
The problem is choosing one. There are three main options, and they’re very different.
The three options
Kubernetes Dashboard was the official web UI for Kubernetes. It shipped with the cluster for years. It’s now deprecated and unmaintained. The last release was v2.7.0 in 2023, and the project was archived shortly after. If you’re still using it, you’re running software that won’t get security patches.
Headlamp is the spiritual successor. It’s now part of Kubernetes SIG UI, actively maintained, and designed to be extensible through plugins. It works with any Kubernetes cluster, not just a specific distribution. In 2025, Headlamp gained multi-cluster views, built-in terminal/exec, and a plugin catalog.
OpenShift Console (also known as the OpenShift web console or origin-web/console) is the built-in UI for OpenShift. It’s tightly integrated with OpenShift-specific features like Routes, BuildConfigs, and Monitoring. If you’re running OpenShift, this is the dashboard you already have. It can also run on vanilla Kubernetes with the right configuration.
Let me look at each one honestly.
Kubernetes Dashboard (deprecated)
The Kubernetes Dashboard was the first serious attempt at a web UI for Kubernetes. It gave you a basic overview: pods, deployments, services, namespaces. You could view logs, exec into containers, and edit resources YAML.
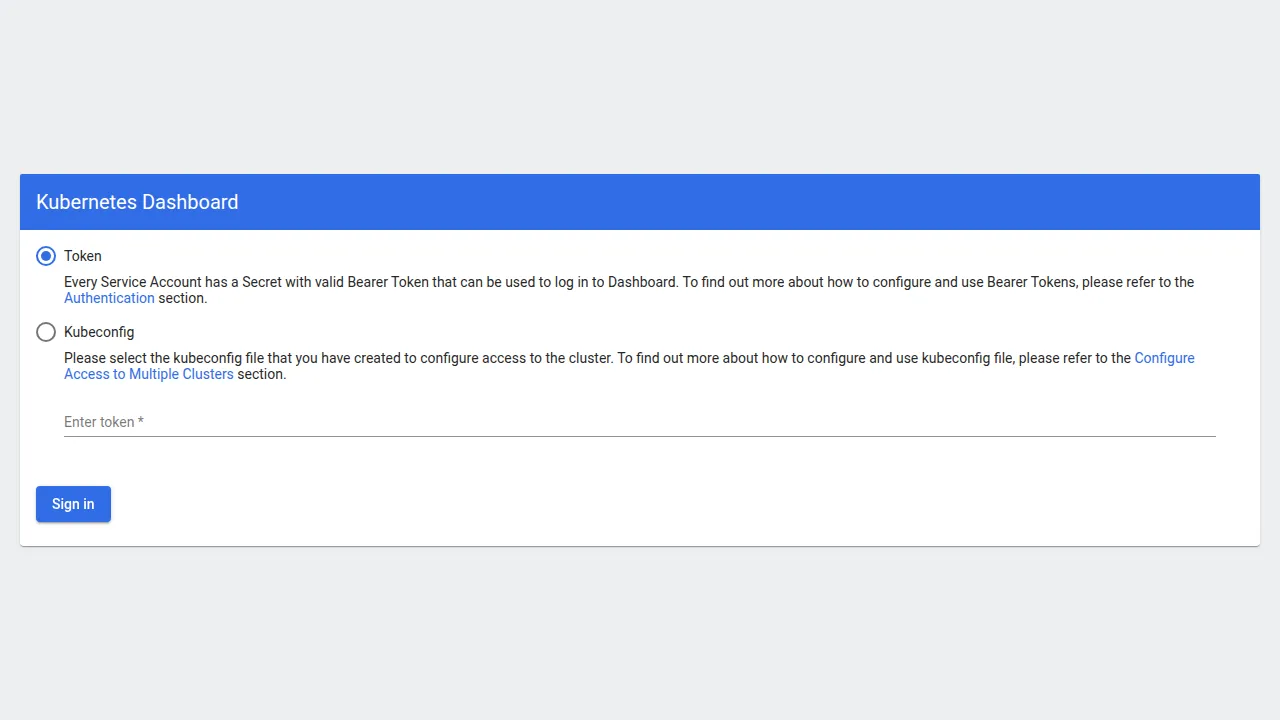
The login screen is straightforward — you paste a token and you’re in:
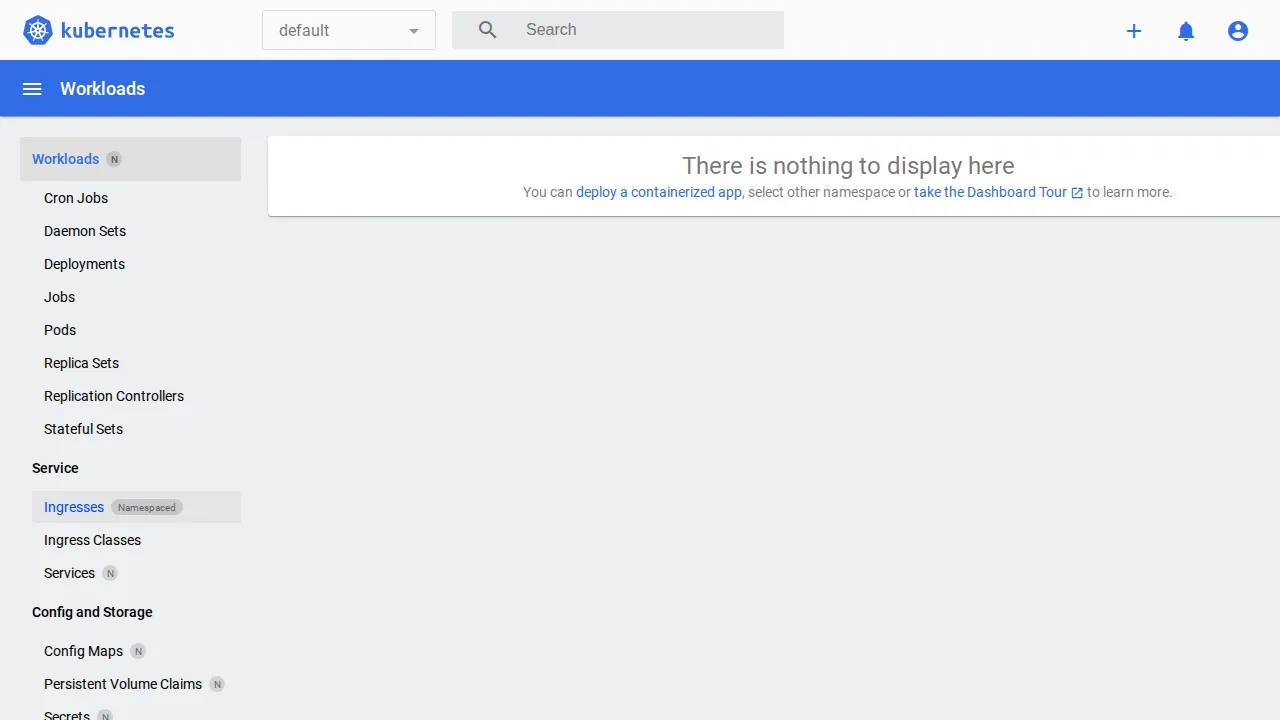
Once logged in, you get a clean but dated interface with sidebar navigation for different resource types:
The problems were always there:
Authentication was painful. Setting up proper access required creating a ServiceAccount, binding it to a ClusterRole, generating a token, and passing that token to the dashboard URL. For a simple web UI, that’s a lot of ceremony.
The UI was dated. The design looked like it was built in 2016 and never updated. Information density was low, navigation was confusing, and the resource views were limited.
No RBAC integration. The dashboard showed everything the ServiceAccount could see, which was usually everything. There was no way to limit what a developer could see based on their namespace.
It’s dead now. The project was archived in 2024. No more releases, no security patches, no bug fixes. If you’re still running it, you’re accumulating technical debt.
If you’re currently using the Kubernetes Dashboard, the migration path is clear: move to Headlamp.
Headlamp
Headlamp is what the Kubernetes Dashboard should have became. It’s a modern, extensible web UI that works with any Kubernetes cluster, and it’s now officially part of Kubernetes SIG UI.
What it gets right:
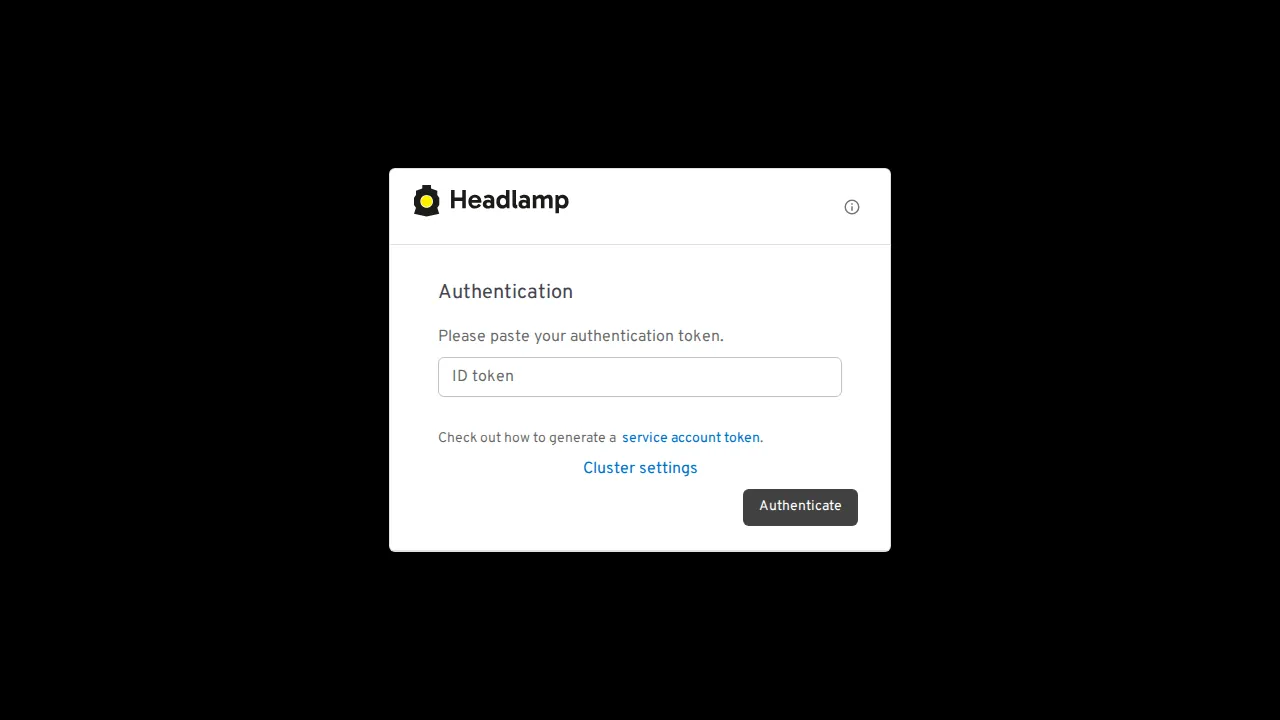
The authentication model is flexible. You can use tokens, OIDC (with PKCE support), kubeconfig files, or service accounts. For clusters with OIDC providers (like Dex or Keycloak), Headlamp integrates directly. For simpler setups, you can paste a Service Account token and you’re in.
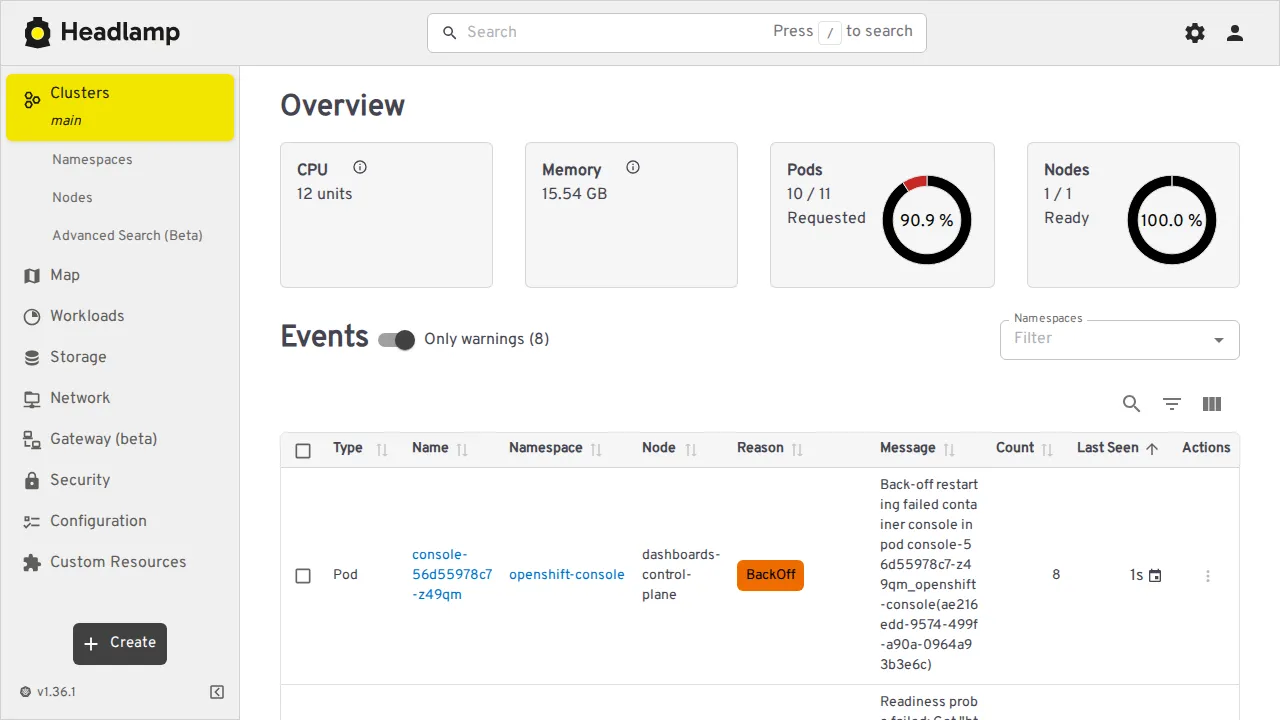
The UI is clean and responsive. Resource lists show the information you actually need: status, age, restarts, labels. Resource details are organized in tabs instead of scrolling through a wall of YAML. The YAML editor is still there when you need it, but it’s not the default view.
RBAC works properly. Headlamp respects Kubernetes RBAC, so developers only see what their ServiceAccount allows. If a developer can’t access a namespace in kubectl, they can’t see it in Headlamp either.
Built-in terminal and exec. You can exec into pods directly from the UI. The 2025 release added an activities model where you can pin exec sessions and logs as ongoing activities, so you can switch between them without losing context.
Multi-cluster view. Headlamp now supports viewing multiple clusters side-by-side. You can compare workloads across environments without switching between tools.
Plugin support is the differentiator. Headlamp has a plugin system that lets you add custom views, dashboards, and integrations. There’s now a plugin catalog on headlamp.dev for discovering and installing plugins. Want a Prometheus metrics tab on your Deployments? There’s a plugin for that.
Where it falls short:
The plugin ecosystem is growing but still young compared to more mature tools. You might need to write your own for specific use cases.
No built-in topology view. Headlamp has a map view for resource relationships, but it’s not as comprehensive as OpenShift Console’s topology view.
Deployment is straightforward:
# headlamp-values.yaml
headlamp:
  config:
    OIDC_CLIENT_ID: ""
    OIDC_ISSUER_URL: ""
    OIDC_CLIENT_SECRET: ""
helm repo add headlamp https://kubernetes-sigs.github.io/headlamp/
helm install headlamp headlamp/headlamp -n headlamp --create-namespace -f headlamp-values.yamlOr without Helm:
kubectl apply -f https://raw.githubusercontent.com/kubernetes-sigs/headlamp/main/kubernetes-headlamp/latest.yamlAccess it with port-forwarding:
kubectl port-forward -n headlamp svc/headlamp 8080:80
# Open http://localhost:8080
OpenShift Console
If you’re running OpenShift, you already have a dashboard. The OpenShift Console is built into every OpenShift cluster and it’s been evolving since OpenShift 3.x. The source code is available at github.com/openshift/console and the container image is published to quay.io/openshift/origin-console.
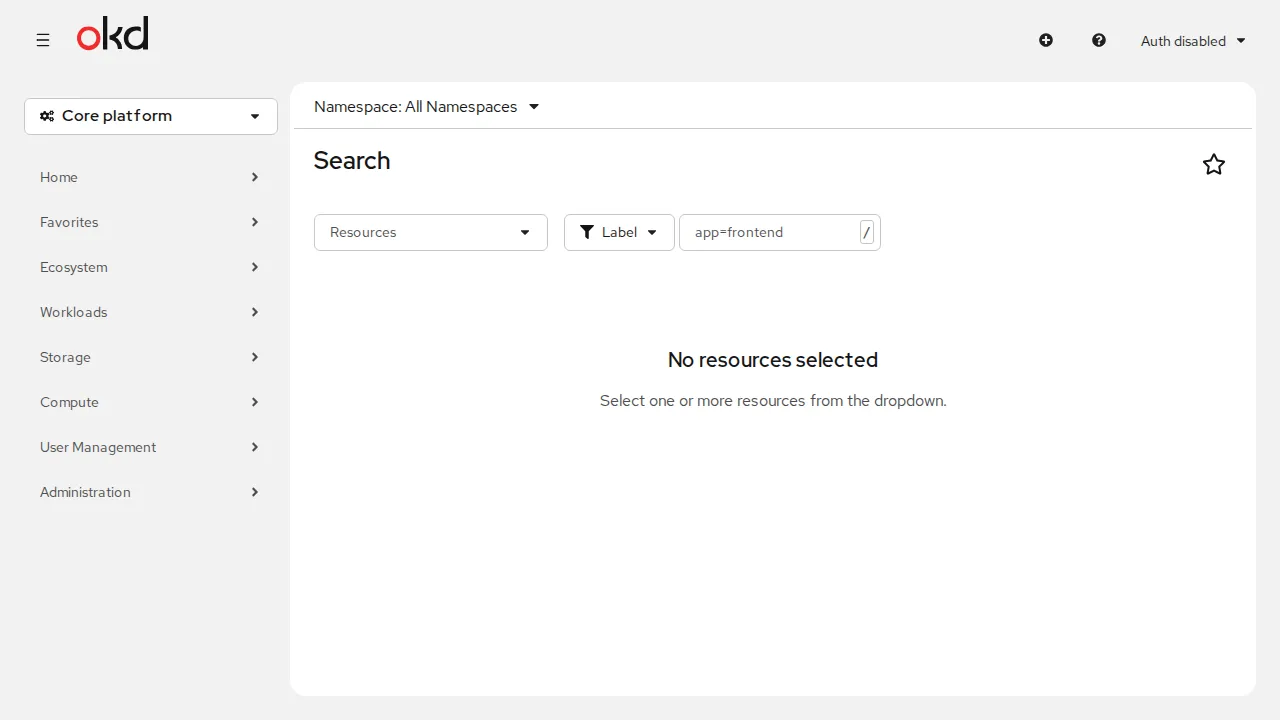
What it gets right:
The integration with OpenShift features is integrated. Routes, BuildConfigs, ImageStreams, DeploymentConfigs, Monitoring, OperatorHub, Pipelines, GitOps. If OpenShift has a feature, the Console shows it. You don’t need to install anything extra.
The Developer and Administrator perspectives are genuinely useful. Developers see their workloads, builds, and pipelines. Administrators see cluster health, node status, and operator management. The perspective switcher is a clean way to separate concerns.
The topology view is excellent. For microservices architectures, seeing your services as a graph with live connections, health status, and resource consumption is incredibly useful. Headlamp doesn’t have anything like this.
Monitoring integration means you can see Prometheus metrics, Grafana dashboards, and alerting rules without leaving the console. The built-in AlertManager UI is right there.
Where it falls short:
It’s opinionated. The Console assumes you’re using OpenShift features (Routes instead of Ingress, BuildConfigs instead of CI/CD pipelines, ImageStreams instead of container registries). If you’re using OpenShift but avoiding some of these features, the Console’s views might not make sense.
Resource consumption. The console is a significant component of OpenShift. It uses memory and CPU on the cluster, which matters on smaller clusters.
On OpenShift, it’s already there. Access it at:
oc login -u kubeadmin -p <password> https://api.<cluster-domain>:6443
# Console URL is shown after login
On vanilla Kubernetes, deploy it with environment variables and a service account token:
env:
- name: BRIDGE_USER_AUTH
  value: "disabled"
- name: BRIDGE_K8S_MODE
  value: "off-cluster"
- name: BRIDGE_K8S_MODE_OFF_CLUSTER_ENDPOINT
  value: "https://kubernetes.default"
- name: BRIDGE_K8S_MODE_OFF_CLUSTER_SKIP_VERIFY_TLS
  value: "true"
- name: BRIDGE_K8S_AUTH_BEARER_TOKEN
  valueFrom:
    secretKeyRef:
      name: console-token
      key: token
kubectl create serviceaccount console -n openshift-console
kubectl create clusterrolebinding console --clusterrole=cluster-admin --serviceaccount=openshift-console:console
kubectl create secret generic console-token \
--from-literal=token=$(kubectl create token console -n openshift-console --duration=24h) \
-n openshift-consoleComparison
| Feature | Kubernetes Dashboard | Headlamp | OpenShift Console |
|---|---|---|---|
| Status | Deprecated (archived 2024) | Active (Kubernetes SIG UI) | Active (Red Hat) |
| Works with | Any K8s cluster | Any K8s cluster | OpenShift + vanilla K8s |
| Authentication | ServiceAccount tokens | OIDC (PKCE), tokens, kubeconfig | OAuth (built-in) |
| RBAC | Basic (ServiceAccount only) | Full Kubernetes RBAC | Full + OpenShift RBAC |
| Multi-cluster | No | Yes (side-by-side view) | Yes (federation view) |
| Terminal/exec | Yes | Yes (with activities model) | Yes |
| Plugin system | No | Yes (with catalog) | No (but extensible) |
| Monitoring | Basic | Via plugins | Built-in (Prometheus) |
| Topology view | No | Map view | Full topology |
| Helm support | No | Yes (in-cluster) | OperatorHub |
| Mobile responsive | Partially | Yes | Yes |
| Resource usage | Low | Low-Medium | Medium-High |
My recommendation
If you’re on vanilla Kubernetes: You have two good options. Headlamp is the more lightweight choice with a plugin system and multi-cluster views. OpenShift Console gives you a richer feature set with topology views and built-in monitoring integration, but requires more configuration. Both support service account tokens for authentication.
If you’re on OpenShift: Use the OpenShift Console. It’s already there, it’s deeply integrated with OpenShift features, and the Developer perspective is genuinely useful for application teams. The topology view is excellent for understanding microservices architectures. Install Headlamp as a secondary option if you want a more lightweight UI for specific tasks.
If you’re still on Kubernetes Dashboard: Migrate to Headlamp. The dashboard is unmaintained and won’t receive security patches. The migration is straightforward since Headlamp supports the same authentication methods and provides a superset of features.
If you manage multiple clusters: Headlamp now supports multi-cluster views, so you can see workloads across clusters side-by-side. For deployment visibility across clusters, consider a GitOps tool like ArgoCD or Flux alongside Headlamp.
The honest take
Dashboards are useful for understanding what’s running, not for managing it. The real work still happens in kubectl, Helm charts, and CI/CD pipelines. A good dashboard gives you a quick visual check: are pods running, is anything restarting, what’s the resource usage. It’s a lens, not a control panel.
Pick the one that fits your stack, give developers read-only access, and don’t spend too much time customizing it. The best dashboard is the one your team actually uses.
Related Posts
Passing the CKA exam after years of Kubernetes
How I prepared for and passed the Certified Kubernetes Administrator exam, and what I'd do differently knowing what I know now.
Namespace Is the New Cluster Boundary
Namespaces aren't just for organizing resources. They're your first line of defense against a single team eating the whole cluster.
Server-Side Apply: Who Wins When Three People Apply the Same Resource?
Three people, three kubectl apply, one resource. Server-Side Apply finally gives you a real answer to who wins.